Unified Observability with Grafana Cloud
Explains how Grafana Cloud integrates app, infrastructure, and Kubernetes monitoring into a unified view.
What Changed Operationally
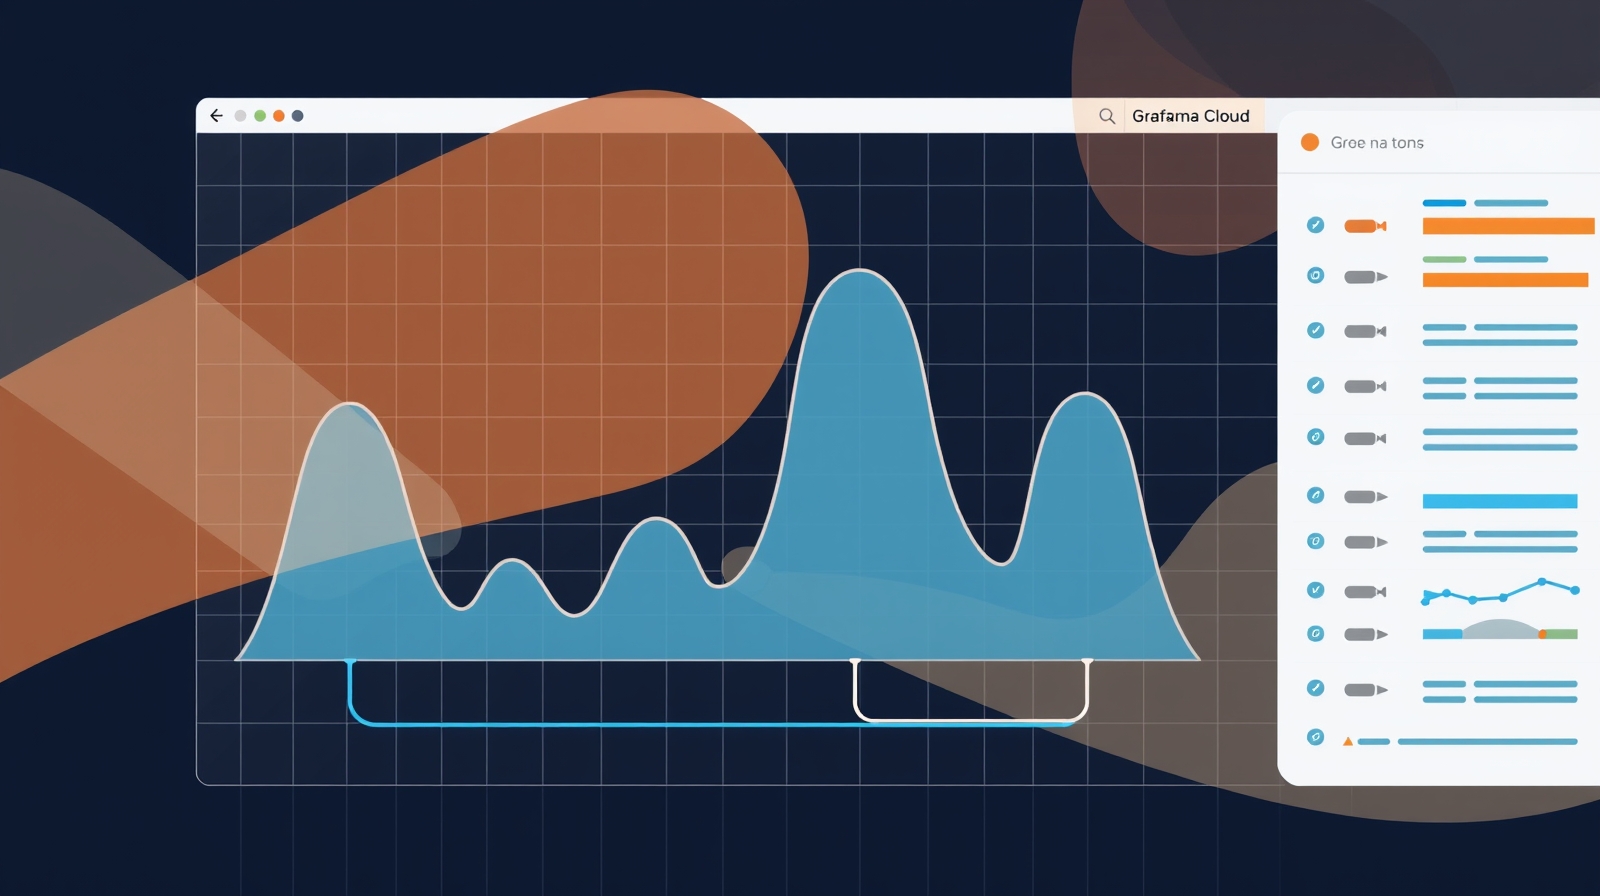
The operational landscape of modern software environments has shifted fundamentally with the integration of application, infrastructure, and Kubernetes monitoring into a unified view. This shift moves teams away from siloed dashboards and fragmented alerting systems toward a consolidated operational reality. In Grafana Cloud, this capability is realized through a mechanism that automatically models applications and infrastructure into a unified graph. This graph serves as the central nervous system for the platform, ingesting telemetry from disparate sources and constructing a dynamic representation of the system's topology. The significance of this change is operational: it transforms how teams investigate issues, moving from a manual, disjointed process of piecing together logs and metrics to a streamlined workflow where the context of the failure is immediately apparent.
At the core of this architecture is the knowledge graph, which powers the platform's ability to correlate data across the full stack. Unlike traditional monitoring that treats metrics, logs, and traces as isolated streams, the knowledge graph identifies entities—such as specific services or infrastructure components—and maps their relationships. This modeling process allows the platform to understand not just what is happening, but how components interact. The platform provides specific features designed to leverage this graph for different stages of investigation. The RCA workbench, for instance, brings insights, dependencies, and telemetry together in a single timeline, allowing engineers to trace the root cause of an incident without switching contexts. Similarly, the entity graph offers a visual representation of the relationships between services, infrastructure, and other components, making the topology of a failure visible at a glance. This architectural approach ensures that the data flow is not merely a collection of metrics but a structured, navigable map of the system's operational state.
To facilitate rapid investigation, the platform provides an entity catalog that acts as a central inventory of all services and infrastructure discovered by the knowledge graph. This catalog combines health status, insights, metrics, and metadata, enabling users to quickly identify what needs attention. Crucially, this inventory is not static; from any of these features, users can launch directly into logs, traces, and profiles for a given entity. The embedded Grafana Drilldown tab opens automatically with filters derived from entity configurations, ensuring that the investigation starts with the relevant data set. Collaboration is further enhanced by the ability to create and share shortened URLs that bring teammates directly to the same view. This feature streamlines the handoff between on-call engineers and developers, ensuring that the context of an investigation is preserved and accessible to anyone involved in the resolution process.
The platform’s ability to tailor this unified view to specific environments is managed through a system of configurations that control how the knowledge graph filters, narrows down, and correlates observability data. These configurations can be created for specific environments, applied only to certain entity types, or defined based on entity properties. The system evaluates these configurations as an ordered list, allowing users to control how conflicts are resolved and ensuring that the graph reflects the specific structure of their environment. If no configuration matches automatically, or if mappings cannot be applied, the system prompts the user with a screen that allows for temporary configuration application. This flexibility ensures that the knowledge graph remains accurate even in complex or evolving environments. Additionally, the platform encourages best practices by recommending the use of consistent fields and labels across metrics, logs, traces, and profiles to make correlation easier. For teams seeking to automate the management of these configurations, the Grafana Terraform provider offers a programmatic way to define and deploy the necessary rules.
While the platform provides a comprehensive view of the stack, it is important to clarify what the product does and does not do. The knowledge graph and the associated features are designed to correlate and visualize the relationships between entities and their telemetry. They do not replace the underlying data sources or the need for proper instrumentation. The effectiveness of the correlation relies heavily on the quality and consistency of the data being ingested. Furthermore, while the platform offers powerful tools for investigation and visualization, it does not perform autonomous remediation. The RCA workbench and entity graph are investigative tools that provide the necessary context and data to resolve issues, but the actual resolution steps must be executed by the user. The platform’s strength lies in its ability to provide a high-fidelity map of the system, which, when combined with human expertise, leads to faster and more accurate incident resolution.
How The Capability Fits Together
<h2>The Role of Multimodal Embeddings in Observability</h2>The integration of advanced machine learning models into observability platforms introduces a new dimension to data correlation, moving beyond structured telemetry to include unstructured data. The recent availability of jina-embeddings-v5-omni on the Elastic Inference Service exemplifies this trend, offering a compact model family that maps all four modalities—text, images, audio, and video—into a single shared embedding space. This capability allows systems to query and correlate data across different formats without the need for separate indexes or manual preprocessing steps. For example, querying with the word "cat" can return relevant cat scenes from a video collection, while a sketch of a car combined with the text "white" retrieves images of white cars. This cross-modal search capability is particularly valuable in complex environments where the root cause of an issue may be hidden in disparate types of data, such as a log file containing a text description of an error alongside a video recording of a system crash.
The operational impact of this multimodal approach is significant, as it enables a more holistic investigation of issues. In a scenario involving a user-facing application failure, an engineer might need to correlate a text error log with a video recording of the user interface to understand the context of the failure. With jina-embeddings-v5-omni, the system can automatically identify the relevant video segment that corresponds to the error, even without explicit text extraction or Optical Character Recognition (OCR) steps. Similarly, audio data, such as system audio logs or user feedback recordings, can be used to retrieve relevant video or image data. This capability reduces the time required to sift through large volumes of unstructured data, allowing teams to focus on the most relevant information. The model's performance on standard benchmarks, such as the Charades-STA benchmark for moment retrieval inside video, where it scores 55.57, demonstrates its effectiveness in these cross-modal retrieval tasks.
The technical architecture of jina-embeddings-v5-omni is designed for efficiency and scalability, making it suitable for operational environments. The v5-omni-small variant, using under one billion active parameters, scores better than leading three billion parameter models and close to a seven billion parameter model that is nearly eight times its size. This efficiency is achieved through a compact model family that prioritizes performance per parameter. Furthermore, the model inherits both of Elasticsearch's major storage optimizations: Better Binary Quantization (BBQ) and Matryoshka representation learning. BBQ achieves 93% storage reduction with less than 3% accuracy loss, while truncating to 256 dimensions and applying binary quantization together cut the index footprint substantially while retaining most retrieval quality. These optimizations are critical for operational environments where storage costs and query latency are major concerns.
The deployment of these models is streamlined through the Elastic Inference Service, which automatically creates inference endpoints and Kibana connectors for both jina-embeddings-v5-omni-small and jina-embeddings-v5-omni-nano with no manual configuration required. This automation lowers the barrier to entry for teams looking to leverage advanced machine learning in their observability workflows. The availability of both small and nano variants allows teams to balance between model performance and resource utilization. While the model is available on the Jina API and Hugging Face under CC-BY-NC-4.0, the Elastic Inference Service provides a managed environment that integrates seamlessly with existing Elasticsearch deployments. This integration ensures that teams can leverage the power of multimodal embeddings without needing to manage the underlying infrastructure or dependencies.
Operational Impact
Configuration and Governance Approaches
Implementing a unified observability stack requires establishing clear governance protocols to manage the complex relationships between services, infrastructure, and telemetry data. The knowledge graph engine, which automatically models these entities, relies on configuration layers to filter, narrow down, and correlate data effectively. Administrators must define default configurations that align with standard environments, but these often require customization to handle specific entity types or unique data structures. Because configurations are evaluated as an ordered list, teams must establish a priority hierarchy to resolve conflicts, ensuring that the most relevant rules take precedence during incident investigations. If a configuration fails to match automatically, the system prompts for manual intervention, creating a necessary checkpoint where engineers can temporarily apply rules or adjust matchers based on property definitions.
To maintain consistency across the stack, governance policies must enforce the use of consistent fields and labels across metrics, logs, traces, and profiles. Without this standardization, the knowledge graph struggles to establish accurate relationships, leading to incomplete entity catalogs or missed correlations during root cause analysis. Teams should document these labeling conventions and integrate them into their CI/CD pipelines to ensure that new services are instrumented correctly from the outset. Additionally, leveraging automation tools, such as the Grafana Terraform provider, allows for the programmatic creation and management of these configurations, reducing the risk of human error and ensuring that governance rules are applied uniformly across all environments.
Rollout And Governance Decisions
Evaluation and Pilot Strategy
Before committing to a full rollout of a full-stack observability platform, organizations should adopt a phased evaluation strategy that validates the platform's ability to handle cross-modal and cross-service queries. A pilot program should focus on testing the platform's core capabilities, such as the Entity Graph and RCA Workbench, to verify that they can successfully correlate telemetry data across different layers of the stack. During this phase, teams should attempt complex queries that span multiple modalities, such as correlating a log error with a specific infrastructure component or tracing a user-reported issue back to a specific service dependency. This hands-on testing allows administrators to assess the accuracy of the entity catalog and the efficiency of the investigation workflow.
The evaluation should also include a rigorous assessment of the platform's performance under load, particularly regarding the storage and retrieval of large volumes of multimodal data. Given the introduction of advanced storage optimizations like Better Binary Quantization (BBQ) and Matryoshka representation learning, it is crucial to measure the impact of these features on index footprint and query latency. Teams should analyze how the system handles data truncation and binary quantization, ensuring that critical information is not lost during the compression process. By establishing clear success metrics—such as reduction in mean time to resolution (MTTR) or storage efficiency—organizations can make data-driven decisions about scaling the platform to production environments.
Failure Modes And Limits
Failure Modes and Configuration Complexity
Implementing a unified knowledge graph introduces complexity that can hinder rapid response if not managed correctly. The system relies heavily on the accuracy of the knowledge graph, which models applications and infrastructure into a unified graph. If the underlying entity configurations are misaligned with the actual data structure, the correlation engine may fail to link relevant telemetry. Users must create configurations that control how the knowledge graph filters, narrows down, and correlates observability data. This process requires manual setup and prioritization, which can be complex for teams without deep expertise in the platform's configuration system. Adjusting the priority of these configurations is necessary to resolve conflicts, but errors in this ordering can lead to incorrect filtering or missed correlations.
Security And Privacy Considerations
Furthermore, the effectiveness of the knowledge graph is contingent on data hygiene. The system is designed to work best when consistent fields and labels are used across metrics, logs, traces, and profiles. Without this consistency, the graph struggles to establish the relationships required for a full-stack view. If no configuration matches the incoming data—or if the mappings cannot be applied—the system prompts the user with an additional screen to manually apply a configuration. While this provides a workaround, it disrupts the automated workflow and requires manual intervention. Additionally, the knowledge graph's ability to provide a visual representation of relationships between services and infrastructure depends on the quality of the metadata ingested from the source systems.
Uncertainty and Privacy Considerations
The deployment of advanced multimodal models, such as the jina-embeddings-v5-omni variants available on the Elastic Inference Service, introduces uncertainty regarding performance consistency across diverse data types. While the model demonstrates strong benchmark results on specific datasets, such as scoring 55.57 on the Charades-STA benchmark for moment retrieval, its performance may vary significantly when applied to unstructured, proprietary data. The model handles text, images, audio, and video in a single shared embedding space, but video retrieval is noted to be more sensitive to truncation. This suggests that for environments with high variability in media types or resolution, the reliability of cross-modal search results may not match the performance seen in controlled testing environments.
Open Questions
Privacy and security considerations also require careful evaluation when integrating these capabilities into production systems. The Elastic Inference Service automatically creates inference endpoints and Kibana connectors for the jina-embeddings-v5-omni-small and jina-embeddings-v5-omni-nano models. This automation streamlines deployment but necessitates strict governance over what data is sent to these endpoints. The models are trained to handle sensitive inputs, such as audio or images, and the storage optimizations like Better Binary Quantization (BBQ) reduce the footprint of these embeddings. However, organizations must ensure that their data pipelines comply with regulations regarding the transmission and processing of multimodal data. The closed-weight status of certain model variants may also limit the ability to inspect or audit the internal processing of sensitive information, necessitating a thorough review of the service's security posture before adoption.
Environment Checklist
Environment Checklist
- Standardize Labels: Ensure consistent fields and labels are applied across all telemetry sources (metrics, logs, traces, profiles) to facilitate accurate knowledge graph modeling.
- Review Configuration Priorities: Audit the ordered list of configurations to ensure conflicts are resolved correctly and that the graph is filtering data as intended.
- Validate Cross-Modal Use Cases: Test the jina-embeddings-v5-omni models on representative samples of your specific data types, particularly focusing on video and audio, to assess retrieval accuracy.
- Audit Data Pipelines: Verify that data sent to Elastic Inference Service endpoints complies with internal security policies and relevant data protection regulations.
- Assess Storage Impact: Evaluate the trade-offs of Better Binary Quantization and Matryoshka representation learning on your specific indexing and query performance requirements.
Verification
This article was not lab-tested. The performance metrics and capabilities described are based on published research notes and vendor documentation. Readers must verify the behavior of the Grafana Cloud knowledge graph and the jina-embeddings-v5-omni models within their specific infrastructure and data environments before deploying them to production.
// source record
Sources
- https://grafana.com/blog/full-stack-observability-in-grafana-cloud-how-to-investigate-issues-across-services-and-infrastructure/ grafana.com · checked 01 July 2026
- https://www.elastic.co/blog/devrel-newsletter-june-2026 www.elastic.co · checked 01 July 2026